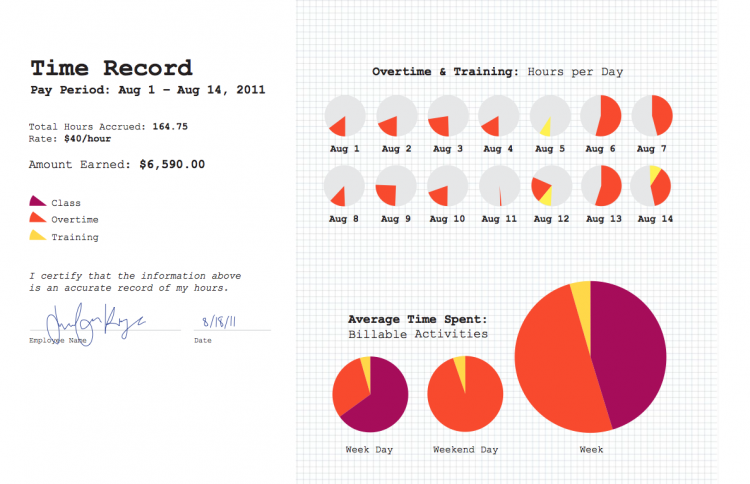
The transition from workplace to school was in the forefront of my mind during our Bootcamp school prep session. I had gone from earning money for the time I spent doing client work to paying money to do school work. For this data visualization project, I decided to represent this life change by showing the “billable hours” I had logged during Bootcamp and what I could have earned if I had put that time toward client work.
The data is slightly depressing, but education is priceless… right?


